

Over the last few weeks I’ve been looking at improving the way I analyse the performance of players with data. A couple of seasons ago I launched my Player Impact metric, which assigns a value to every on-ball action by a player during a match.
Actions that helped the team increase their probability of scoring a goal, receive a positive score, whilst on the other hand actions that decrease the chance of scoring a goal receive a negative score. To a read a little bit more about my Player Impact metric, there’s a more in-depth piece that I wrote on the Analysts Bar website here.
For a while now I’ve wanted to make some further adjustments and additions to this metric though, to the point where I felt it appropriate to rebuild it and create something new. I’m calling this Points Above Replacement, or PAR.
Fans of other sports, particularly American Sports like Baseball & Ice Hockey, might be familiar with the metric Wins Above Replacement (WAR). This metric estimates how many additional wins a player contributes to his team, compared to a readily available replacement player in the same role.
The aim here is to assign a value to answer the question “how much better than the average player is Player A?”. This is exactly what PAR is trying to do - so let me get in to some of the workings into this metric.
What Goes In To PAR?
Player Impact was built off the back of the widely used Expected Threat metric, developed initially by Karun Singh, who later went on to work with Arsenal as a Data Scientist. PAR still uses the same principle, but with some further tweaks based on data availble from matches across Europe within the last year.
Without getting into too much detail, I’ve revamped the scoring values behind the non-shot actions a player makes during the game. This pitch image below shows the values that can be translated to percentages - each zone shows the proportion of open play actions starting there that were followed by a goal for the same team within the next 12 seconds.
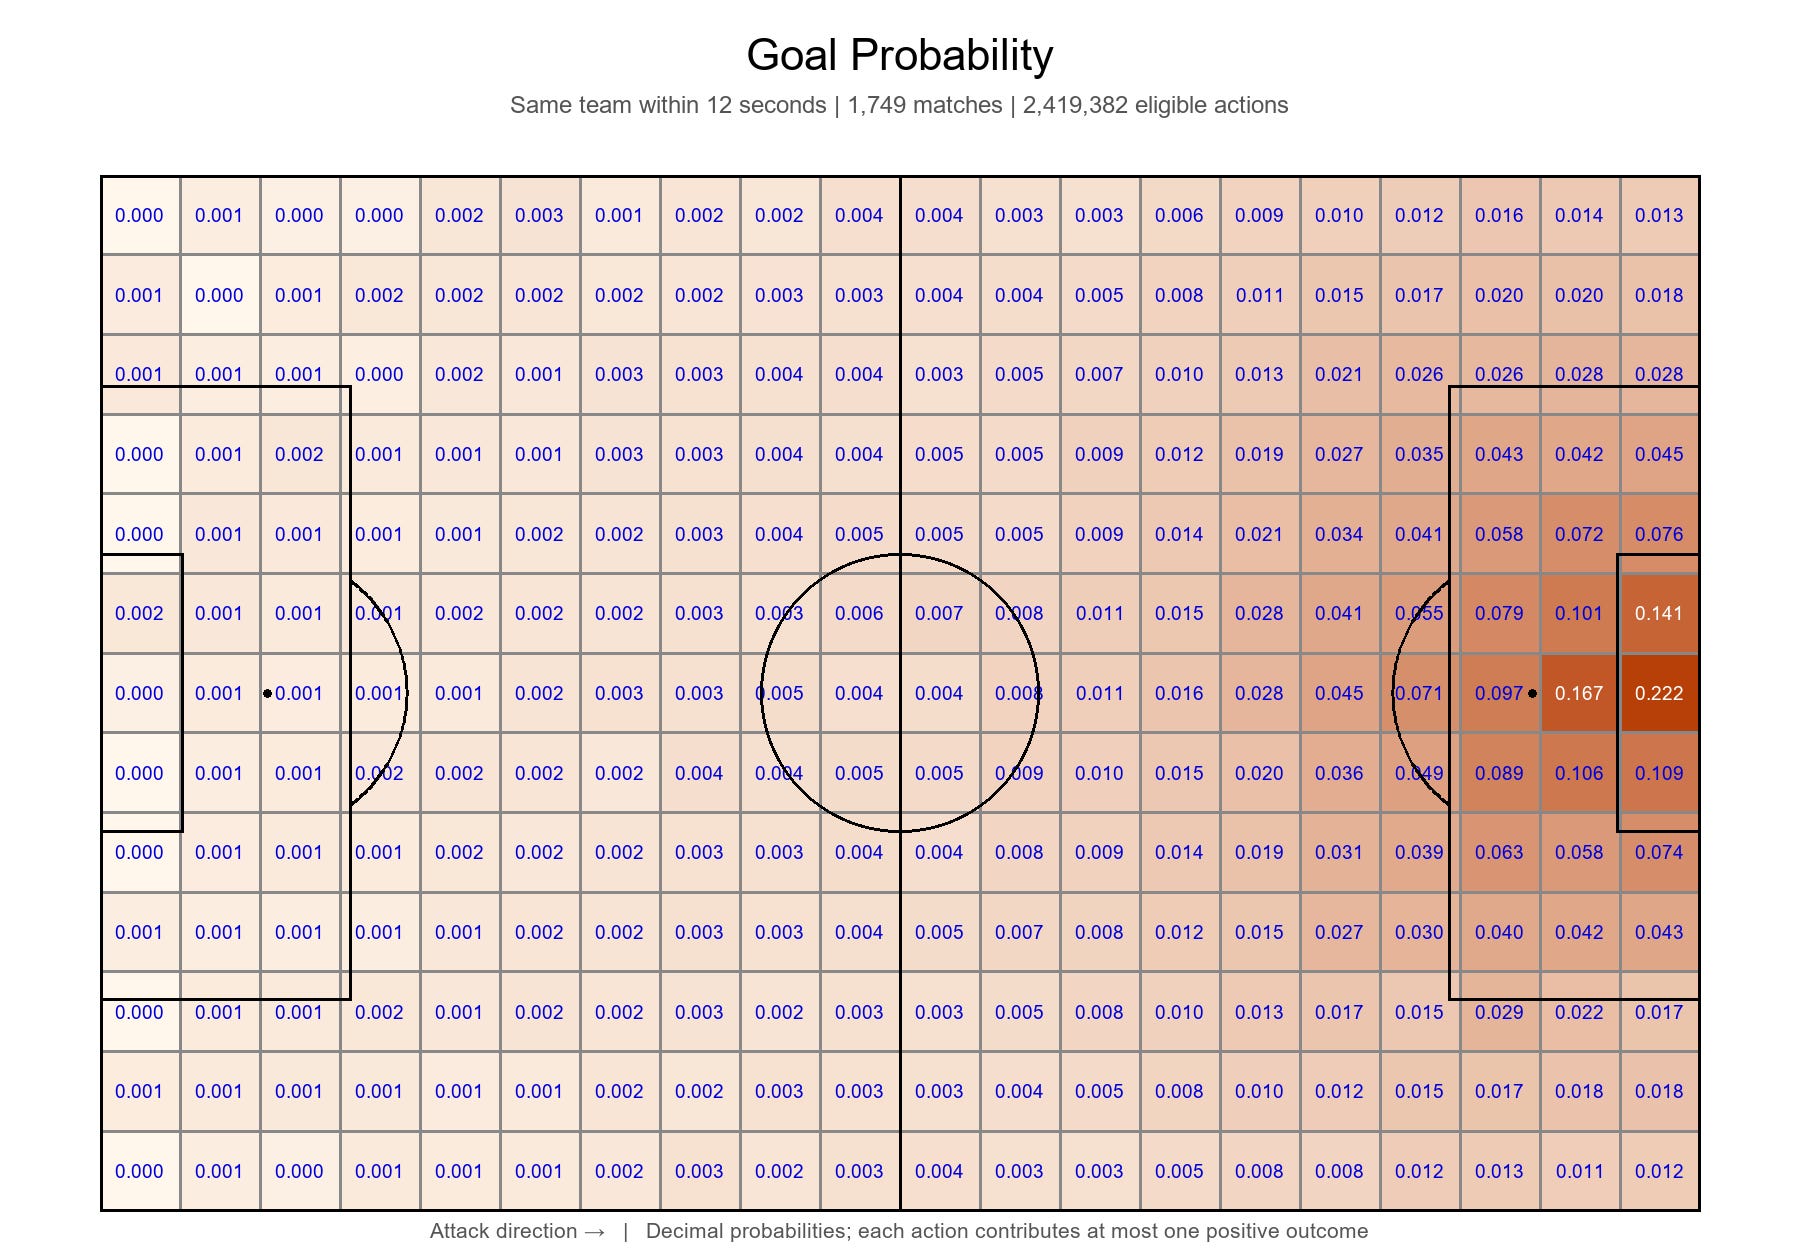
You’ll see quite clearly that the closer to the opposition goal (the team here is attacking from left to right), the more likely a team is to score a goal - this isn’t anything new, of course this will be the case. But we’re able to assign a value to it that can then be built in to the PAR calculations. Conversely, we can then use these values to determine how a defensive actions harms the opposition’s chances of scoring.
What this is telling you is that across 1,749 matches in Europe’s top divisions last season, if a team attempted a pass from just inside the attacking left corner of the box, there’s a 4.3% chance that they will score a goal within the next 12 seconds. If that attempted pass is a cross that successfully reaches a team mate just in front of the penalty spot, that likelihood increases to 16.7%. For the purpose of PAR, the player making that pass is awarded with the difference in those percentages, in this case 12.4%(0.124).
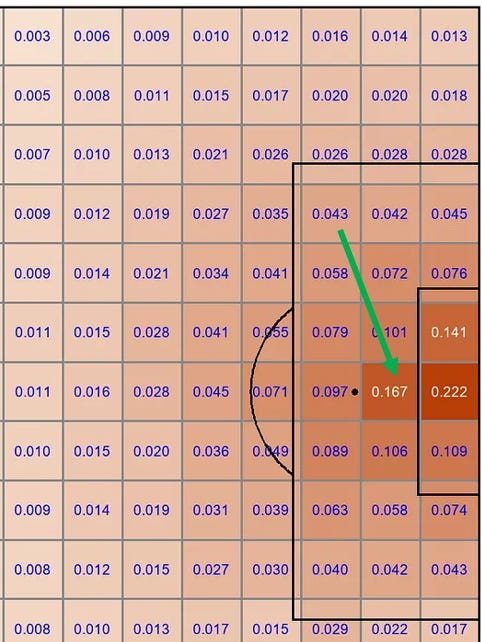
However, from a defensive point of view, if a defensive player was to make an interception and/or clearance from that cross, then they have reduced their opponent’s chance of scoring by that zone amount of 16.7% (0.167).
Shots are treated differently within PAR, seeing as we are able to measure not only the chance quality (xG), but also the shot quality (xGOT) too. The thinking here within PAR is that if a striker takes a shot from the edge of the box where the xG is 0.05, but aims his shot really well toward the corner and is given an xGOT figure of 0.22, then according to the data he has increased his team’s likelihood of scoring.
In this instance, if the goalkeeper makes a save then the shot taker would be given a value of 0.17, as the shot quality is higher than the chance quality.
There are moments where we deviate slightly from this thinking though, in particular for rewarding goalscorers and the player making the assist too, as after all these are the real difference-making actions within a game.
‘Negative’ actions, such as bookings & own goals, are also treated differently, this time with a negative score. We also assign a small value for defenders & midfielders involved in clean sheets, and also a small penalty for when a goal is conceded.
The other key thing I’ve introduced here is a weighting related to the timing and scoreline within a game. Seeing as we’re trying to give a value to players that is related to Points, we’re making actions that take place whilst the scoreline is level, weighted a little heavier - with the theory being that these actions help the team gain an advantage (or pass the advantage to the opposition) when the game is finely balanced.
To think of it in a more simple way - I’d argue that a goal scored at 0-0 to make the scoreline 1-0, is more important when trying to calculate the impact on gaining Points, than the 4th goal scored in the 90th minute in a 4-0 win.
How Does PAR Differ To Player Impact
The biggest difference with PAR & Player Impact, is that we’re able to come up with actual positive & negative values attributed to players. These values are relevant within the company of their peers in the same league. Player Impact is still relevant within a single match, where the data can show who has the biggest impact on the field on that specific day.
Over the course of a season, my Player Impact metric at times was shown as an overall + or - figure, but that didn’t have any real relation to what we were seeing on the pitch, it was just a number.
PAR allows us to really differentiate those players having a postive contribution for their team, whilst also comparing them to the positional average within the league too. It can then get taken a little further and help us compare across all positions, with the key point being that if we add up every player’s PAR score then it will always total at 0.
We’ll then compare a player’s total with their positional peers, accounting for their playing time, and convert the difference into an estimated points contribution. We do this using the relationship between the actual points teams have won and the combined value of their players’ actions on the pitch, as described above.
From that, a score of +1 PAR represents an estimated contribution of one point above what an average player within that competition would produce in the same position and game time.
Player Impact as a metric will still remain in my analysis, but mainly as a way of analysing performances within a single match across all players on the pitch.
Current Premier League Rankings
Despite the small sample size, we’ll still take a quick look at the highest scorers according my new PAR metric - but first we’ll have a sense check around the total PAR per team compared with league position. You’d expect to see the teams higher up in the league generally have the highest total PAR from their players.
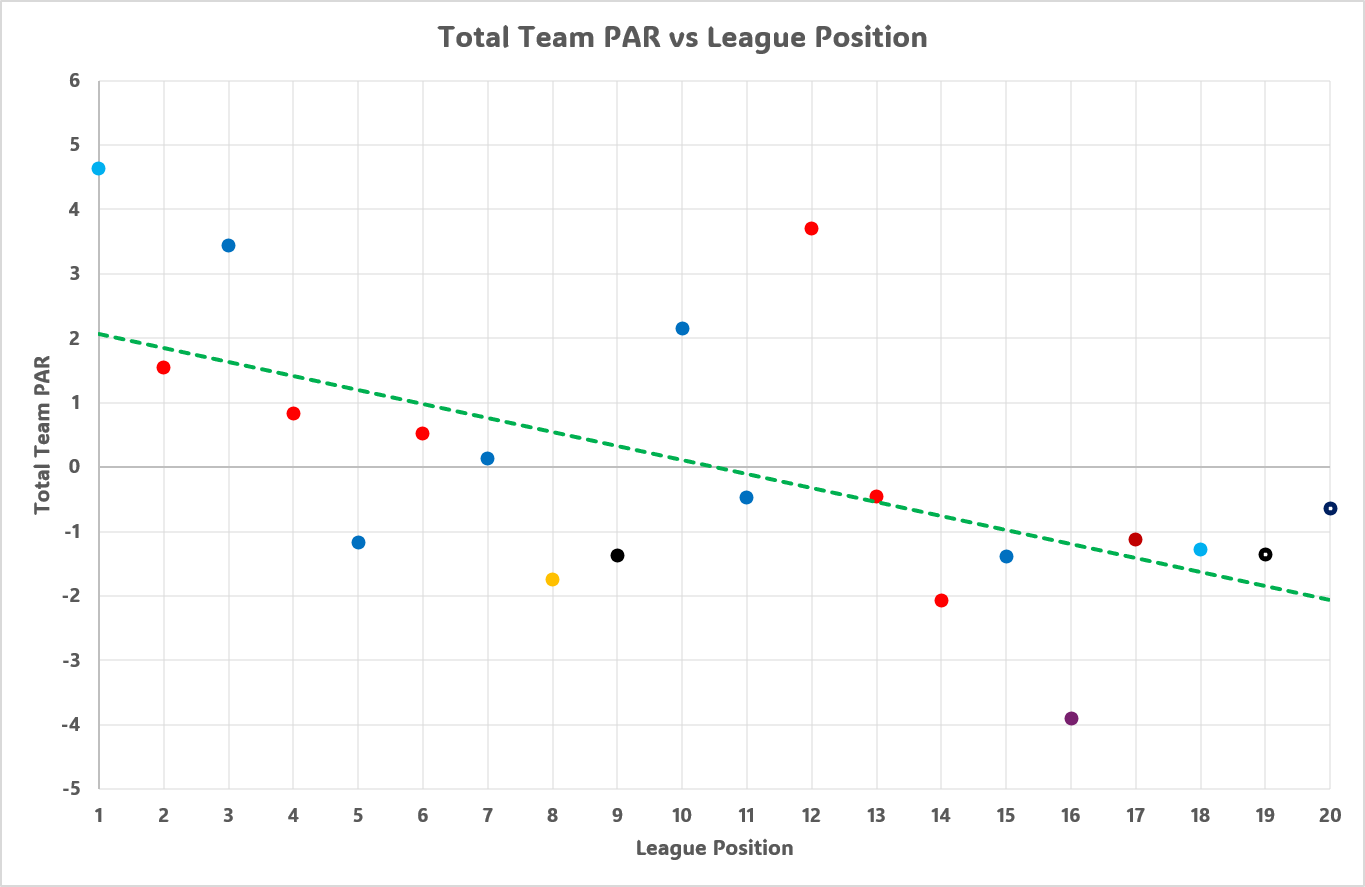
And that is indeed what we do see - there are a couple of outliers, most notably Chelsea in 10th position & Man Utd in 12th position, but otherwise the trend line is pretty clear that teams lower down in the league have a smaller total PAR among their squad.
Now let’s take a quick look at the current leaders in PAR after the opening 5 games of the Premier League season, including only players who have played at least 50% of minutes this season (225). Man City are sitting pretty at the top of the table, driven by some fantastic performances by Rayan Cherki & Erling Haaland, who rank 1st & 3rd respectively.
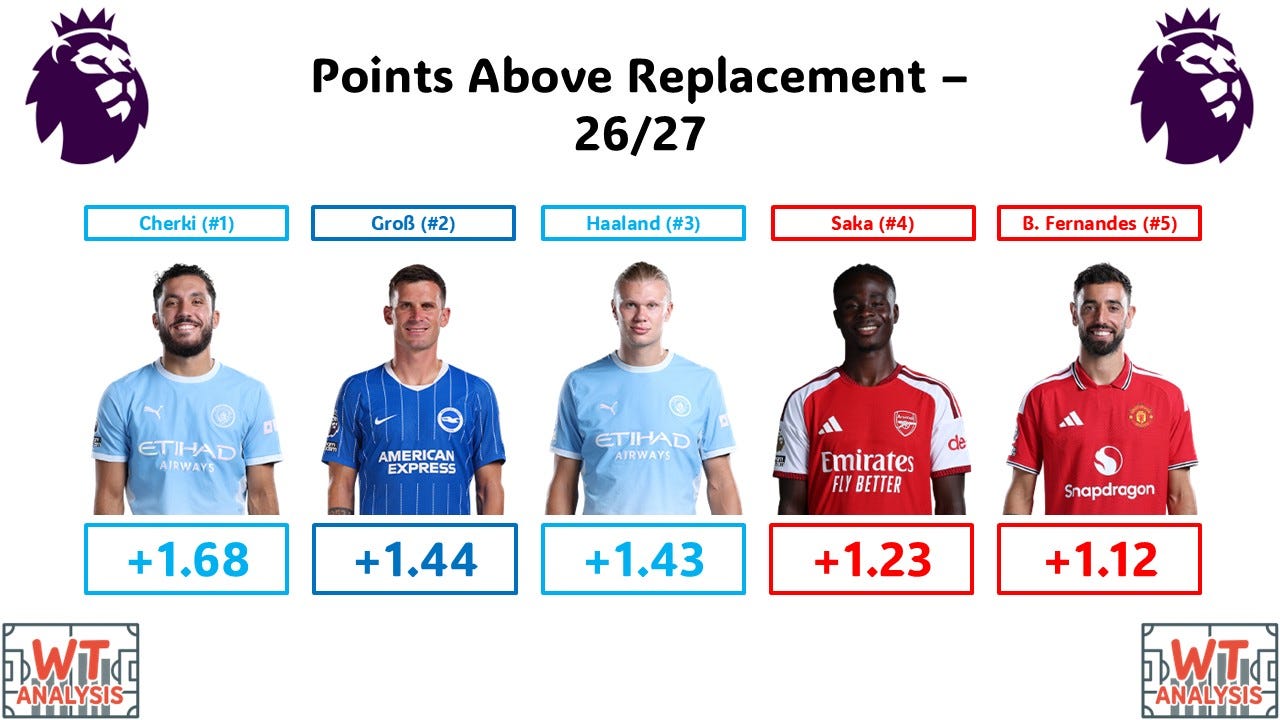
Pascal Groß has also been enjoying a fine start to the season for Brighton, he ranks in 2nd spot just ahead of Haaland. Bukayo Saka comes in 4th position after scoring 3 in the opening 5 games, with Bruno Fernandes - who had the highest PAR in the Premier League last season, completing the current top 5.
Looking just at Nottingham Forest’s rankings, the club have 11 outfield players who have played over 225 minutes in the Premier League this season, with 5 of them currently holding a positive PAR score, signifying they are performing above the average level compared to their peers.
Morgan Gibbs-White, who ranked 8th in the Premier League on this metric last season, leads the way for Forest in this campaign. It’s likely that Gibbs-White’s PAR score will improve once the sample size of players in his position increases. He’s followed closely by Liam Delap who has quickly established himself in the starting lineup.
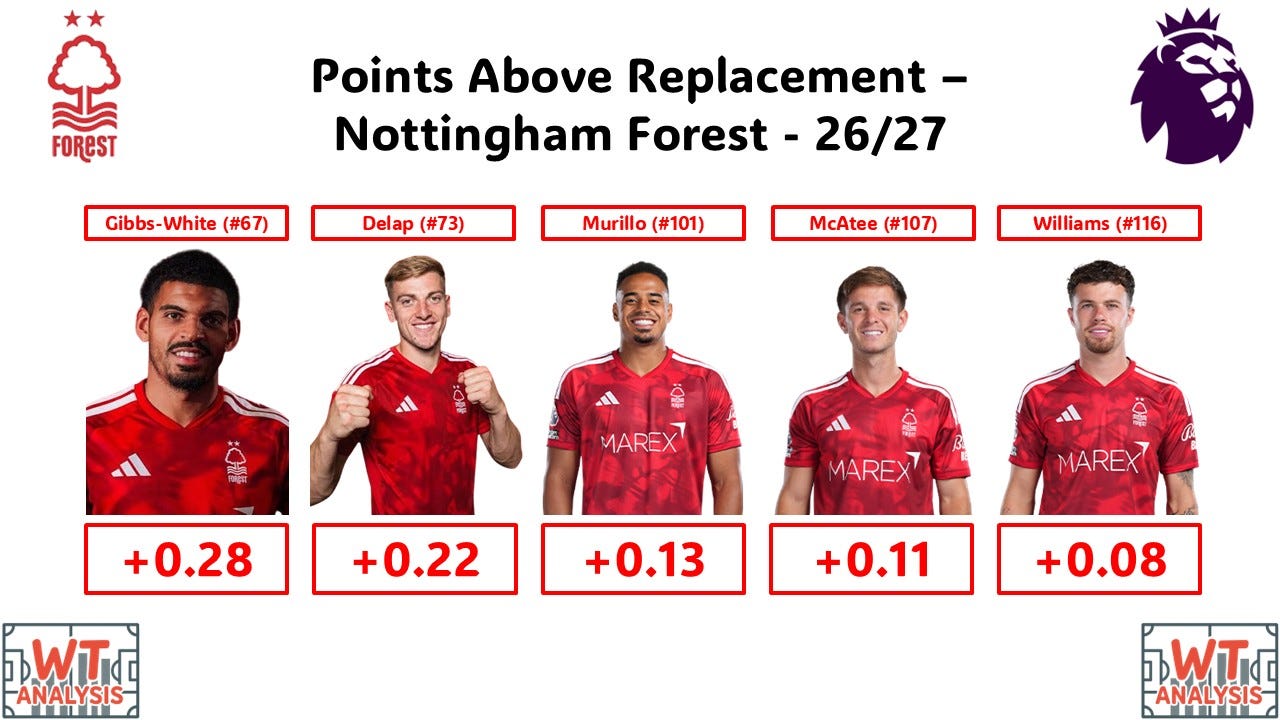
In 3rd spot for Forest is Murillo - a player who I suggested in the summer would have a key role to play in Oliver Glasner’s system. He’s popped up in advanced areas of the pitch in all phases, and is having a decent start to the season. He’s followed by another player who is key to the tactical plan in James McAtee, as he’s making the most of his new lease of life under the Austrian.
The top 5 is closed off by Neco Williams, last season’s player of the year who is still adjusting to his more advanced role on the left hand side. It should also be pointed out that just missing out on the sample size filter is Daniel Munoz, who is actually leading the Forest side in PAR despite only playing just over 210 minutes.
PAR Is Still An Incomplete Metric
Like the vast majority of publicly available and published metrics, PAR is also missing some really important context and data points. Although tracking data (that will show you the positioning of all 22 players on the field as often as 25 times per second) is available for some leagues, that is only generally for historical seasons.
Data for current seasons is incredibly expensive to get hold of, and therefore is kept behind closed doors within each club’s training ground, as data teams will be creating metrics similar to PAR for leagues all over the world.
That means that PAR is only able to measure ‘on-ball’ actions by players, but as we all know, so much of football is what happens off the ball. That run behind by a striker that isn’t found by a team mate, that small pressure by a winger, that forces his opponent to go backwards, that sideways shuffle from a central midfielder to close off a passing lane - all of these actions cannot be captured by the event data used by PAR.
There’s also some work I’d still like to do to the metric - particularly in that I’ll soon be including Goalkeepers within the output. Although we can fairly easily analyse the performance of goalkeepers by looking at their Goals Prevented - later this season I’ll be sharing a more well-rounded view that includes all of the actions a goalkeeper makes during the game.
Finally, particularly at this very early stage of the season, there’s a huge caveat around the sample size. One very good performance in the opening 5 games of the Premier League season will really boost a player’s current PAR score. But once we’re able to use this across a far larger sample size, and then create something along the lines of a ‘PAR per 10 games’ metric, then we’ll be able to compare players far more fairly.